Case study · Denmark
Fanø: emptying by data instead of gut feeling
An island whose population multiplies sixteenfold in summer, 82 semi-buried containers, and a 20% reduction in emptyings within two months.
Fanø Municipality is a Danish island whose population fluctuates between 3,000 and 50,000 across the year. It installed fill-level sensors on all 82 of its semi-buried waste containers across 14 recycling sites. Within two months, the number of emptyings had fallen by 20%, against a target of 25%.
Why fixed frequencies were impossible
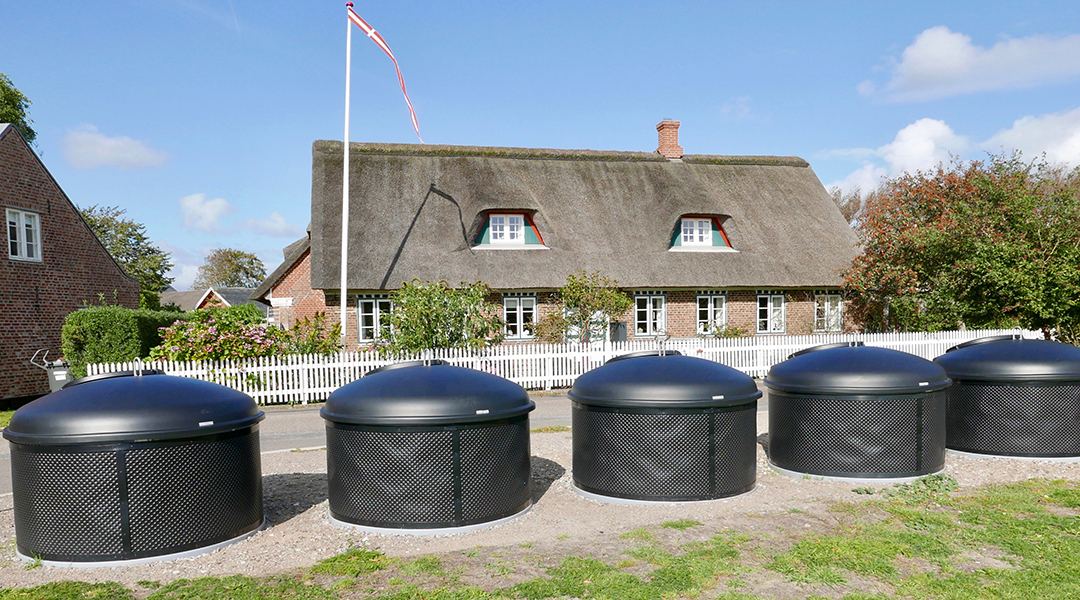
Fanø has roughly 3,400 permanent residents and around 2,900 summer cottages. It operates six “super” recycling collection points and eight regular recycling stations. The regular stations mainly serve permanent residents and take cardboard, plastic and cans; the super points sit near the holiday cottages and also take organic and residual waste. All 82 containers are semi-buried and hold up to three cubic metres.
In areas with permanent residents, containers typically take between two weeks and a month to fill. In the summer cottage areas, the same containers fill in anywhere between one or two days and several weeks, depending on the weather. The senior engineer responsible described planning efficient waste collection in advance as almost impossible, and was blunt about the previous method: emptying happened by gut feeling.
The pressure was compounding. Increased online shopping and greater environmental awareness among residents and visitors had pushed recycling volumes at the collection points roughly 20% above the level assumed when the collection contract was tendered. The authority needed better operating economics and, simultaneously, to stop residents encountering overloaded containers.
We simply cannot plan our emptyings because a few days of sunshine can change the picture completely. So far, the emptying has taken place by gut feeling, and that's how we usually do it.Senior engineer, technical administration — Fanø Municipality
What was deployed
Sensors were installed on all 82 containers, measuring fill level and passing the data to the municipality via the cloud. Signals are sent up to 60 times a day, giving minimal battery consumption, low cost and good coverage.
The workflow is simple and worth describing because it is what most UK authorities would actually run. On screen, the engineer sees every container with its fill level marked green, amber or red. He marks the containers to be emptied, creates a route plan, and sends it to the contractor, who receives it in the driver app. The contractor uses the same app to report when each container has been emptied. Fill history for each container is available, so he can judge how urgent an emptying is rather than treating every red flag identically.
An honest note about accuracy
Accuracy was not good at the beginning. Working with the supplier, the authority established that the sensor needed to be positioned slightly differently to avoid false signals. Once repositioned, when a sensor reported 90% full, it was 90% full. A built-in algorithm also learns continuously and becomes more accurate over time.
We include this deliberately. Mounting position is the most common cause of early inaccuracy in a sensor deployment, and it is entirely avoidable — which is why we set position per container type at installation and validate first readings physically before a container joins live round planning.
The results
- Emptyings reduced by 20% within the first two months, against a target of 25%.
- The target reduction would bring the number of emptyings back down to the level assumed in the original tender, despite volumes having grown 20% since.
- The authority expected the investment to pay for itself within a manageable period.
- Complaints about missed emptying became documentable — the municipality can now show whether a container was emptied or not.
Bringing the contractor in
Fanø's handling of its contractor is instructive, because the contractor's initial concern is universal. The lorry driver, the engineer noted, might worry about having fewer containers to empty — but he shouldn't. He stops spending time checking containers that turn out to be half full and which it makes no sense to empty and invoice, and that time can be sold to another customer. His administration also reduces, because invoicing data comes directly through the app.
Connecting the contractor to the system was planned as the project's next step, so that emptying orders arrive directly from the platform rather than being passed on by the municipality.
Deployment at a glance
- Location
- Fanø Municipality, Denmark (island)
- Population
- 3,000 to 50,000 depending on season
- Permanent residents
- Approximately 3,400
- Summer cottages
- Approximately 2,900
- Sites
- 6 super recycling points, 8 regular recycling stations
- Containers
- 82 semi-buried, up to 3 m³ each
- Reporting
- Up to 60 signals per day
- Fill pattern — resident areas
- 2 weeks to 1 month
- Fill pattern — cottage areas
- 1–2 days to several weeks
- Volume growth
- ~20% above the level assumed at tender
- Target
- 25% reduction in emptyings
- Achieved
- 20% reduction within two months
- Early issue
- Sensor mounting position causing false signals — resolved by repositioning
- Contractor
- Receives route plans and reports completion through the driver app
These figures are as published by the operating authority. They document a deployment of BrainyBins® by Maacks ApS — the platform Britannia IoT Solutions supplies in the United Kingdom — and are presented as evidence for the technology rather than as a Britannia IoT Solutions client engagement. Outcomes in any given operation depend on current collection frequency, bin density and round geography — which is what a pilot measures.
Questions
Reading the Fanø deployment
Accuracy was poor at first. Should that worry us?
It should inform how you run an installation rather than put you off. The cause was mounting position, not the sensor: a unit placed where a fixed object sits in its field of view reads the object instead of the waste. Repositioning fixed it, and afterwards a reported 90% meant 90%. We treat this as a solved problem by setting mounting position per container type during installation and physically validating first readings before a container enters live round planning — which is exactly the step that was missing at the start of Fanø's deployment.
Does this apply to a UK coastal or tourist authority?
Almost line for line. Substitute a Cornish coastal parish, a Lake District village or a Norfolk broads settlement for Fanø and the description holds: a small permanent population, a large seasonal one, containers whose fill rate depends on the weather, and a collection contract priced against volumes that have since grown. The seasonal swing is precisely the condition a fixed timetable cannot serve, and it is where sensors deliver the most.
Why up to 60 readings a day when other deployments use six?
Because the fill rate is volatile. A container that can go from empty to full in a day during a hot spell needs closer monitoring than a street bin filling steadily over a fortnight. Higher reporting frequency shortens battery life proportionally, so it is a deliberate trade-off made per deployment — and it can be varied seasonally, running high in peak months and lower over winter.
Can semi-buried containers really be monitored reliably?
Yes, and they are among the best candidates, precisely because there is no way to judge their fill level from ground level. Fanø runs 82 of them at up to three cubic metres each. NB-IoT was chosen in part because it maintains a signal below ground level and inside metal enclosures where ordinary mobile connectivity degrades.
Next step
See what your own bin data would say
A 90-day pilot on one round tells you exactly how much of your current collection effort is going to bins that were not full. No commitment beyond the pilot, and you keep the data.